Read time: 4 minutes
Today I’m going to show you how to avoid being blind in Prod by using the logging capabilities of ASP.NET Core.
Logging is one of those things that you don’t really need until you do, and then you really need it.
Unfortunately, it’s also one of those things that are easy to overlook when you’re building your app.
Having good logs in Prod will save your day, there’s no excuse not to have them.
I’ll show you how to start logging important events in no time, and how to send those logs to Azure Application Insights, so you can quickly spot issues and fix them before your users notice.
With good logging in place you’ll be able to:
- Have a record of all the important events that happened in your app.
- Know exactly what’s going on in your app at any given time.
- Have peace of mind knowing that you’ll be able to quickly spot issues in Prod.
- Have a way to quickly fix issues before your users notice.
Here’s how to get started, step by step:
Step 1: Use ILogger methods to log important events across your app
ILogger is available anywhere you need it in your application. For instance, here’s how you can use it log an informational event in your Program.cs file:
app.Logger.LogInformation(5, "The app is ready to go!");
The first parameter, which is optional, is the event ID. You can use it to group related events together.
The second parameter is the message you want to log.
What if you want to use ILogger in one of your classes?
No problem, just inject it in your constructor:
public class GameMatcher
{
    private readonly ILogger<GameMatcher> logger;

    public MyService(ILogger<GameMatcher> logger)
    {
        this.logger = logger;
    }
}
And then use it wherever needed:
public class GameMatcher
{
    ...
    public async Task<GameMatch> MatchPlayerAsync(string playerId)
    {
        logger.LogInformation("Matching player {PlayerId}...", playerId);
        ...
    }
}
How about logging exceptions?
Again, no problem. Just use the LogError method:
var match = await repository.FindMatchForPlayerAsync(playerId);

if (match is null)
{
    logger.LogError("No match found for player {PlayerId}.", playerId);
}
What’s the deal with the curly braces in the log messages?
That’s to take advantage of feature called Structured Logging, which allows you to add additional information to your logs. You’ll see how to use that to filter your logs in a moment.
Step 2: Export logs to Azure Application Insights
You need to take those logs out of your box and into the cloud.
For this, open a Terminal, switch to your app dir and install the Azure Monitor OpenTelemetry Distro client library:
dotnet add package --prerelease Azure.Monitor.OpenTelemetry.AspNetCore
Then, register the Azure Monitor OpenTelemetry services by adding the following line to your Program.cs file:
builder.Services.AddOpenTelemetry().UseAzureMonitor();
That will take care of exporting all logs to Azure Application Insights, without you having to write any additional code.
Step 3: Connect your app to Azure Application Insights
If you don’t have an Azure Application Insights account, check out this article to learn how to create one and how to grab the connection string you’ll need next.
Then, go back to your Terminal and add your connection string as a user secret via the Secret Manager tool:
dotnet user-secrets init
dotnet user-secrets set "AzureMonitor:ConnectionString" "YOUR CONN STRING HERE"
Step 4: Start your app and get it to log events
Start your app and start hitting a few of the endpoints where you added logging.
Also try making it so that some errors are thrown and logged to get some interesting traces.
You should see your logs pop on your terminal:
info: MatchMaker.Api.Services.GameMatcher[0]
      Matching player player4...
info: MatchMaker.Api.Services.GameMatcher[0]
      player4 assigned to match e4805ce0-04ba-4d63-b048-a4e2b8de5043.
fail: MatchMaker.Api.Services.GameMatcher[0]
      No match found for player player5.
Give it a few minutes (data will not show up in real time in App Insights) and eventually App Insights should should have processed your logs so you can start querying them in the Azure Portal.
Step 5: Query your logs
Go back to your Application Insights resource in the Azure Portal and click on the Logs blade.

Then, close the Queries popup dialog and type the following query in the query editor:
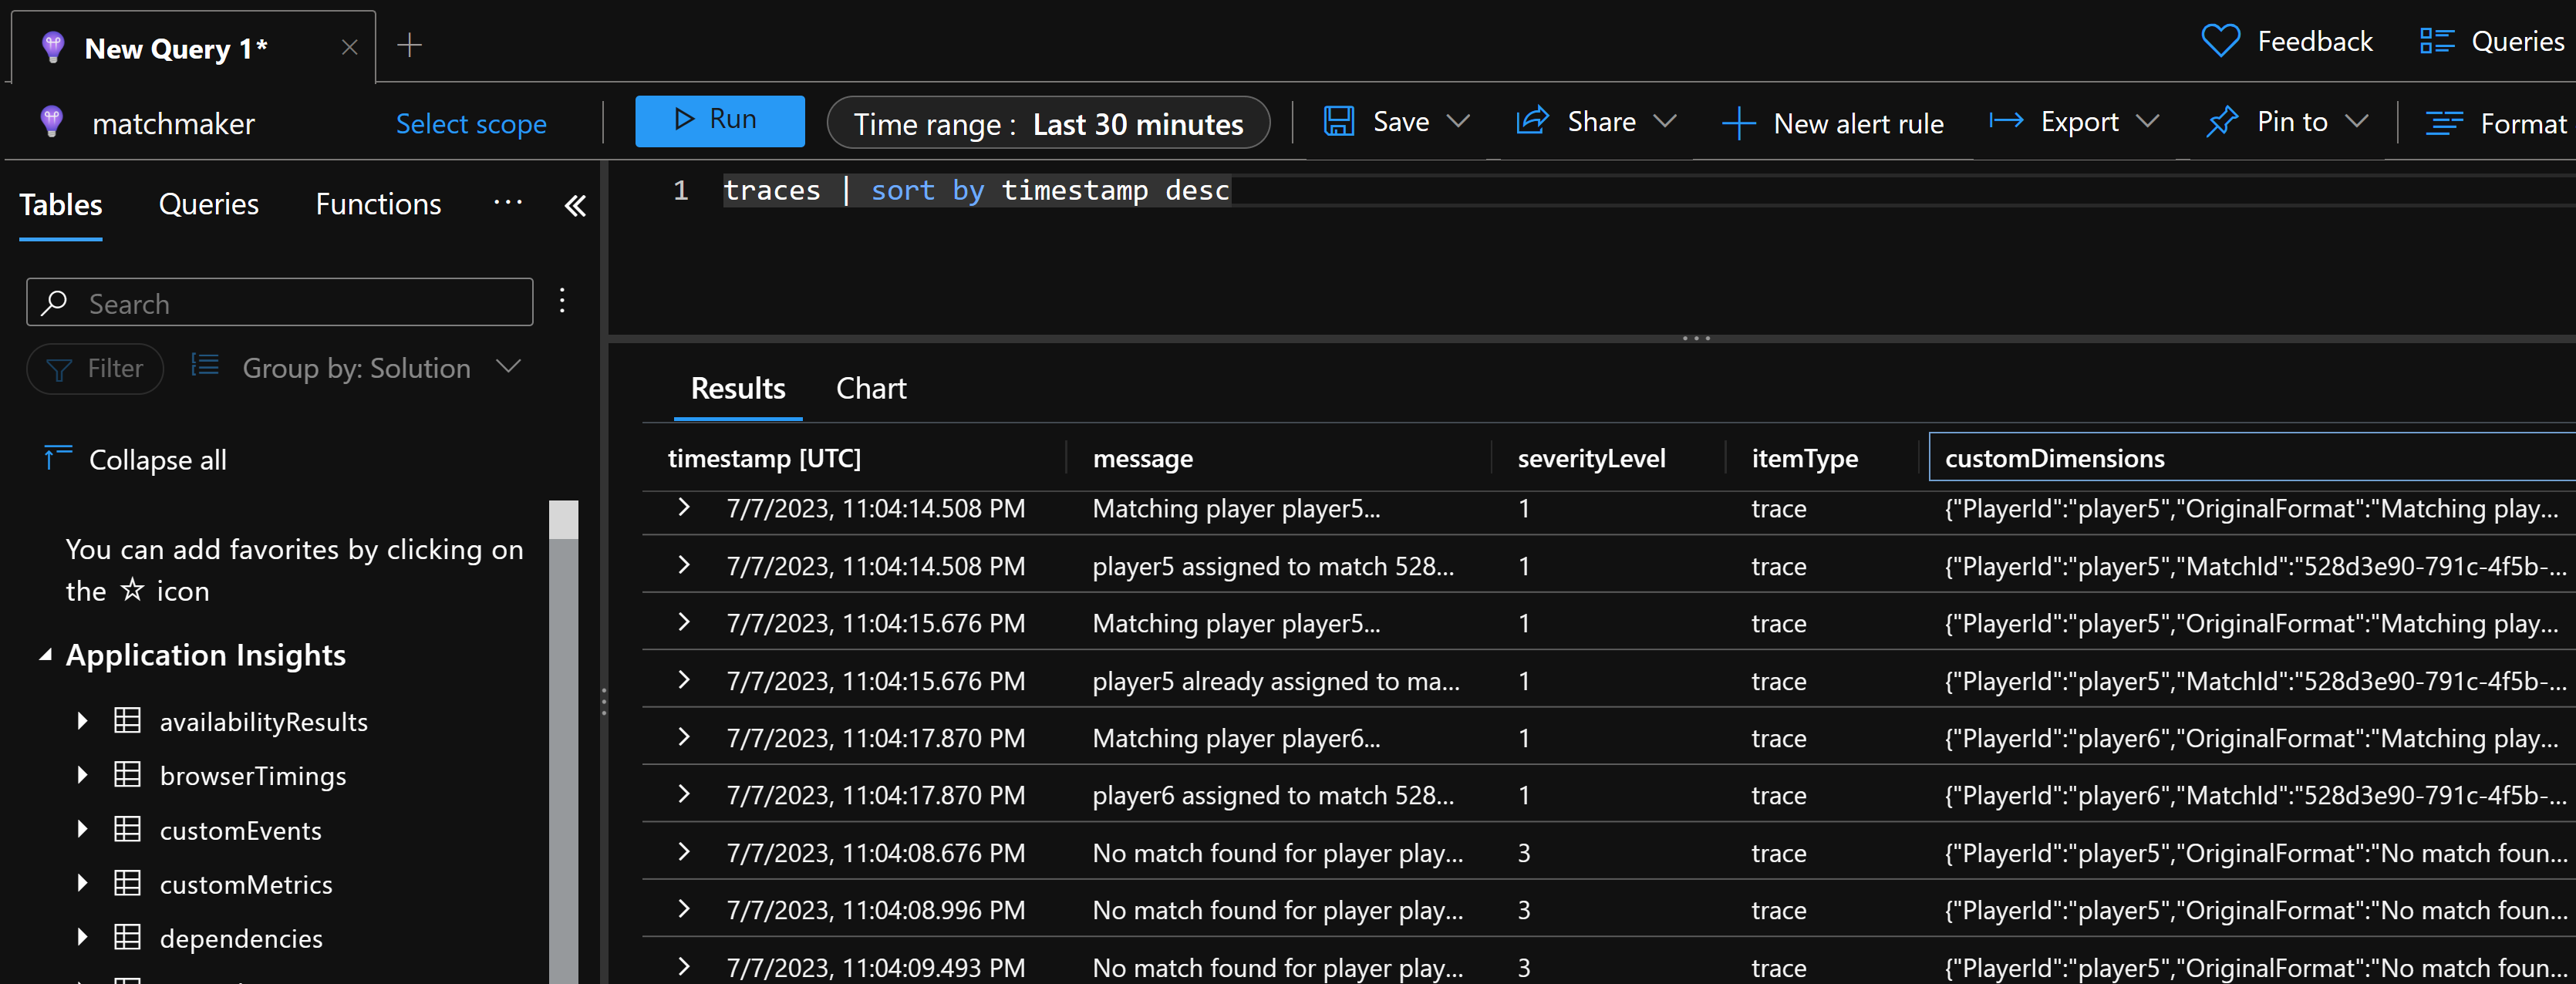
traces | sort by timestamp desc
Select a short time range, say 30 minutes and hit Run.
You should see your logs showing up in the results pane:
Want to filter the results to show only errors?
Do this instead:
traces | where severityLevel == 3 | sort by timestamp desc
How about filtering by a specific player?
That’s why we used structured logging. Because of the curly braces you used when logging messages, you can now do this:
traces | where customDimensions.PlayerId == "player2" | sort by timestamp desc
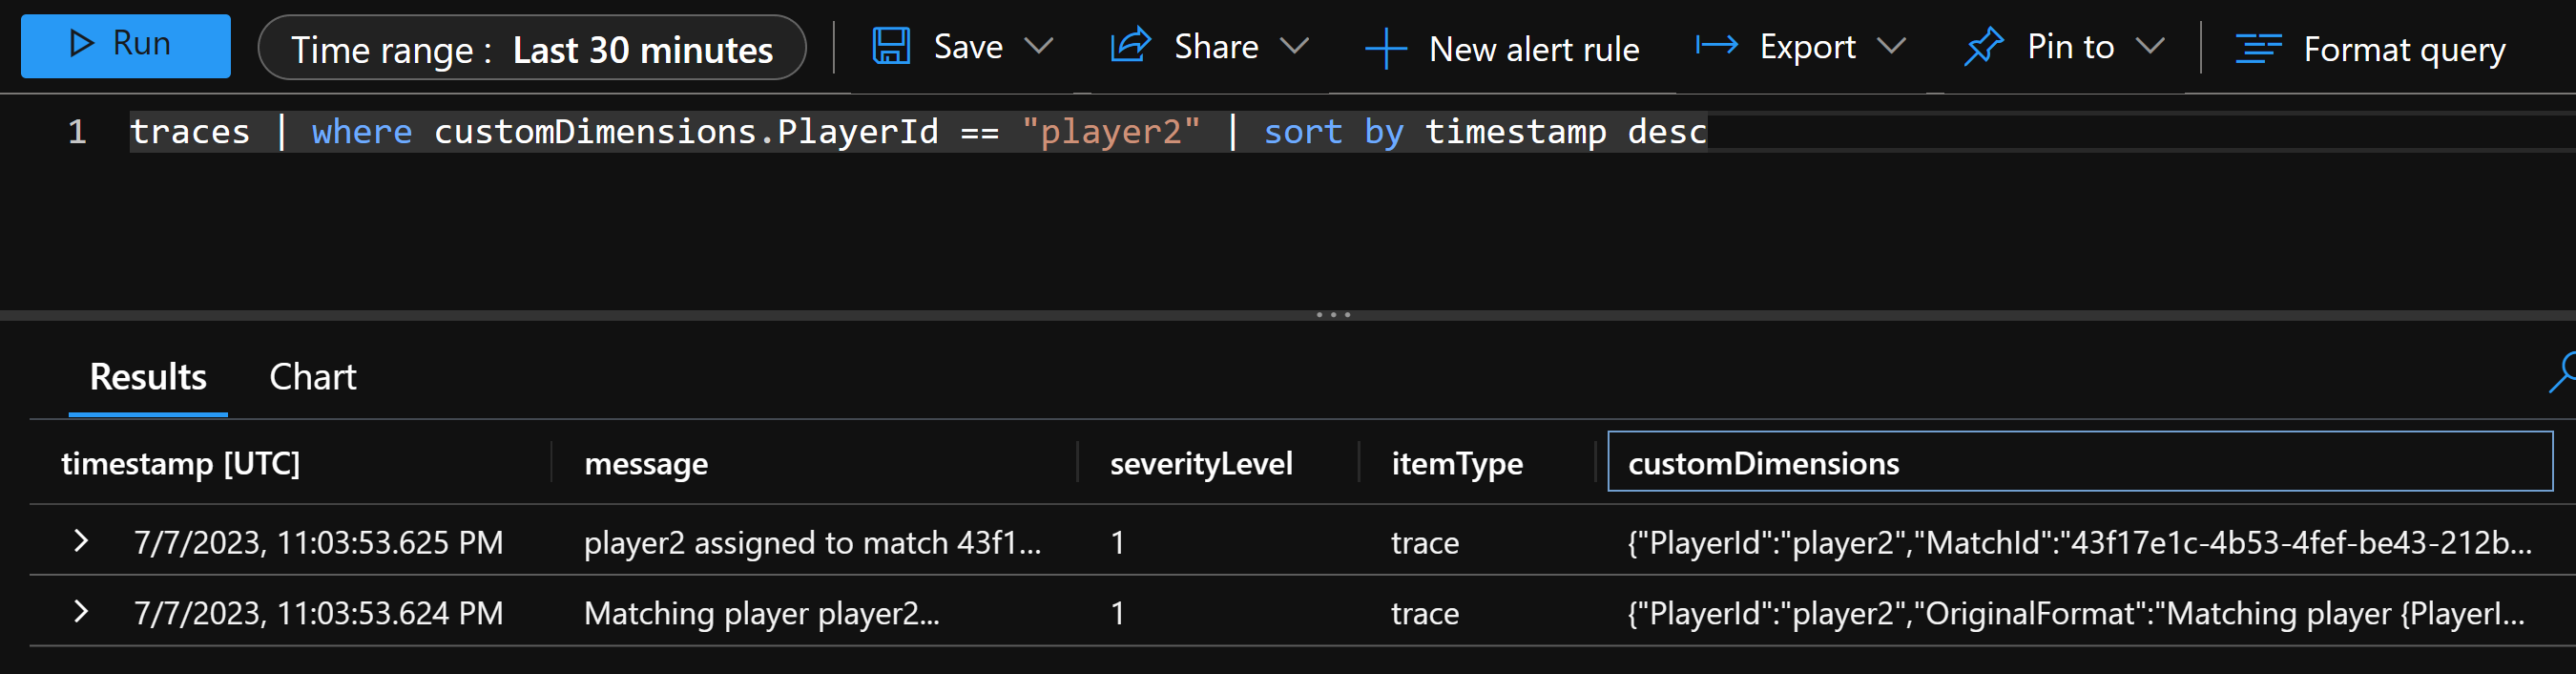
And there you go, you can now query your logs from anywhere you can access your Azure Portal to quickly get to the bottom of any issues that might be happening in your app.
There’s a lot more you can do with the .NET logging system that I didn’t get to cover here, but I do cover in my in-depth courses, if you are interested.
An that’s it for today.
I hope you enjoyed it.
Whenever you’re ready, here’s how I can help:
The .NET Developer Bootcamp: A complete path from ASP.NET Core fundamentals to building, containerizing, and deploying production-ready, cloud-native apps on Azure.