Read time: 5 minutes
Scripts and slide decks are done, so we are ready to start recording!
And, as I worked through the dozens of lessons included in the upcoming bootcamp, I realized that, as usual, I was packing too much in a single course.
I believe shorter courses are better since people are busy, and breaking the content into smaller, more focused courses makes it easier to fit learning into your schedule and achieve incremental results without feeling overwhelmed.
So, after structuring things in a better way, I broke down the bootcamp into 9 courses, grouped into 3 stages that currently look like this:
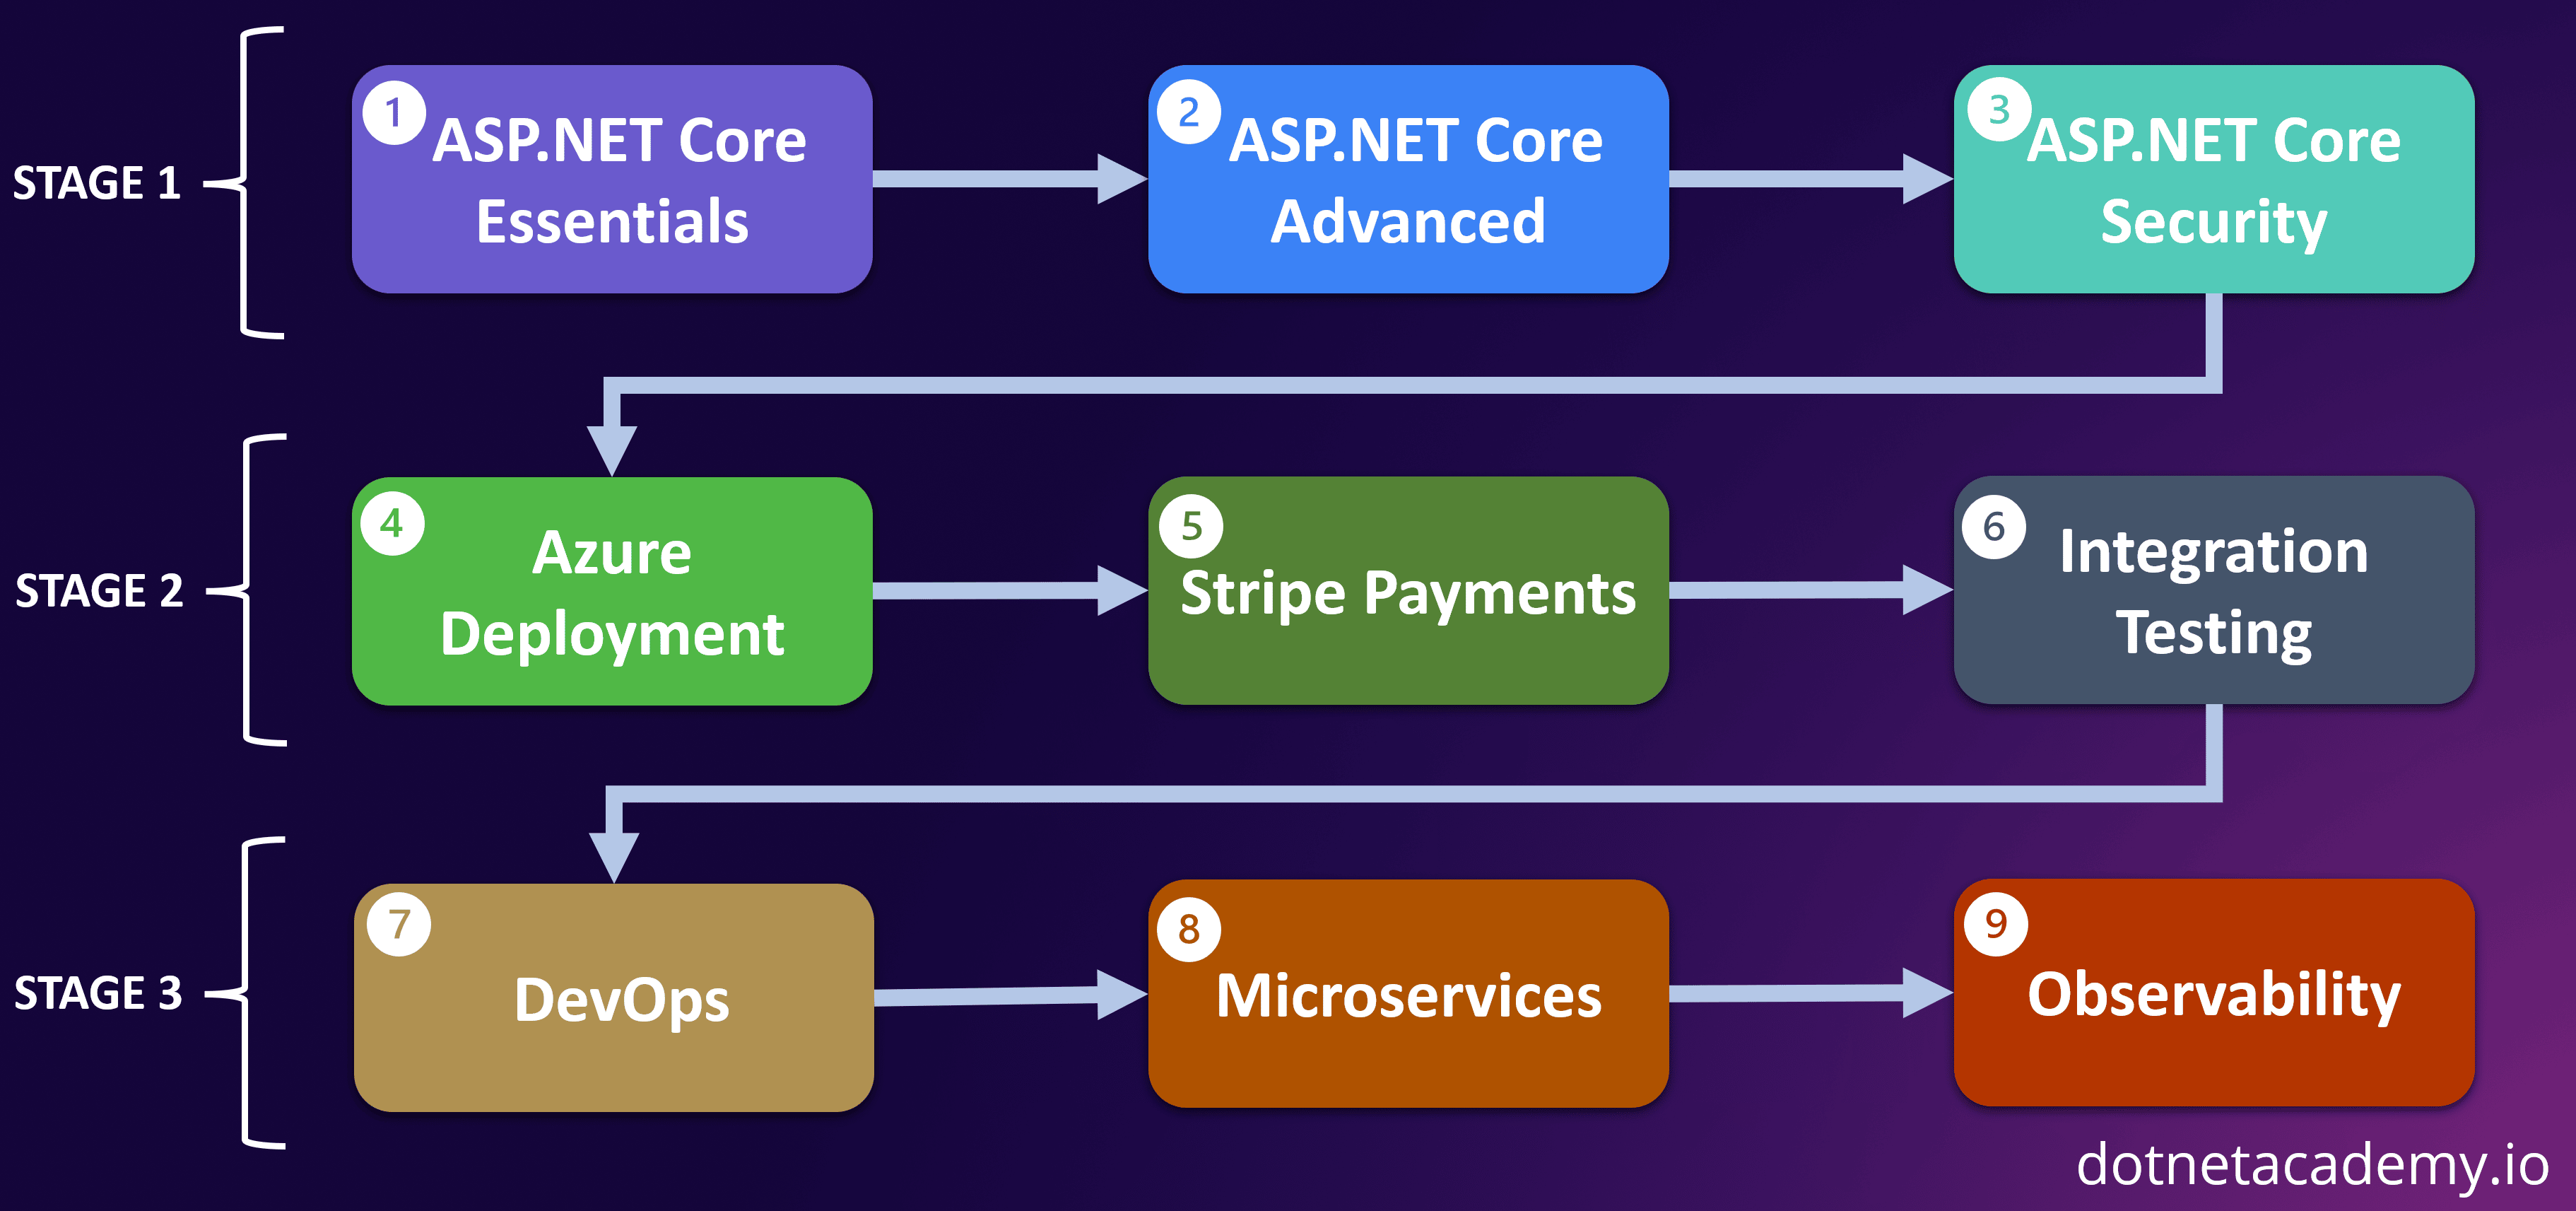
The scripts and slides I just finished cover the 3 courses on stage 1, each course with anywhere between 8 and 9 modules, with each module broken down into several bite-sized lessons.
Can’t wait to share more since there’s so much to unpack in each of those courses!
But now let’s get into the topic of the day: HTTP Logging.
Enabling HTTP Logging
HTTP Logging is a nice piece of middleware available in the ASP.NET Core platform that allows you to log every request and response that goes through your application.
This can become very handy to understand how your application is behaving in production and to do proper troubleshooting.
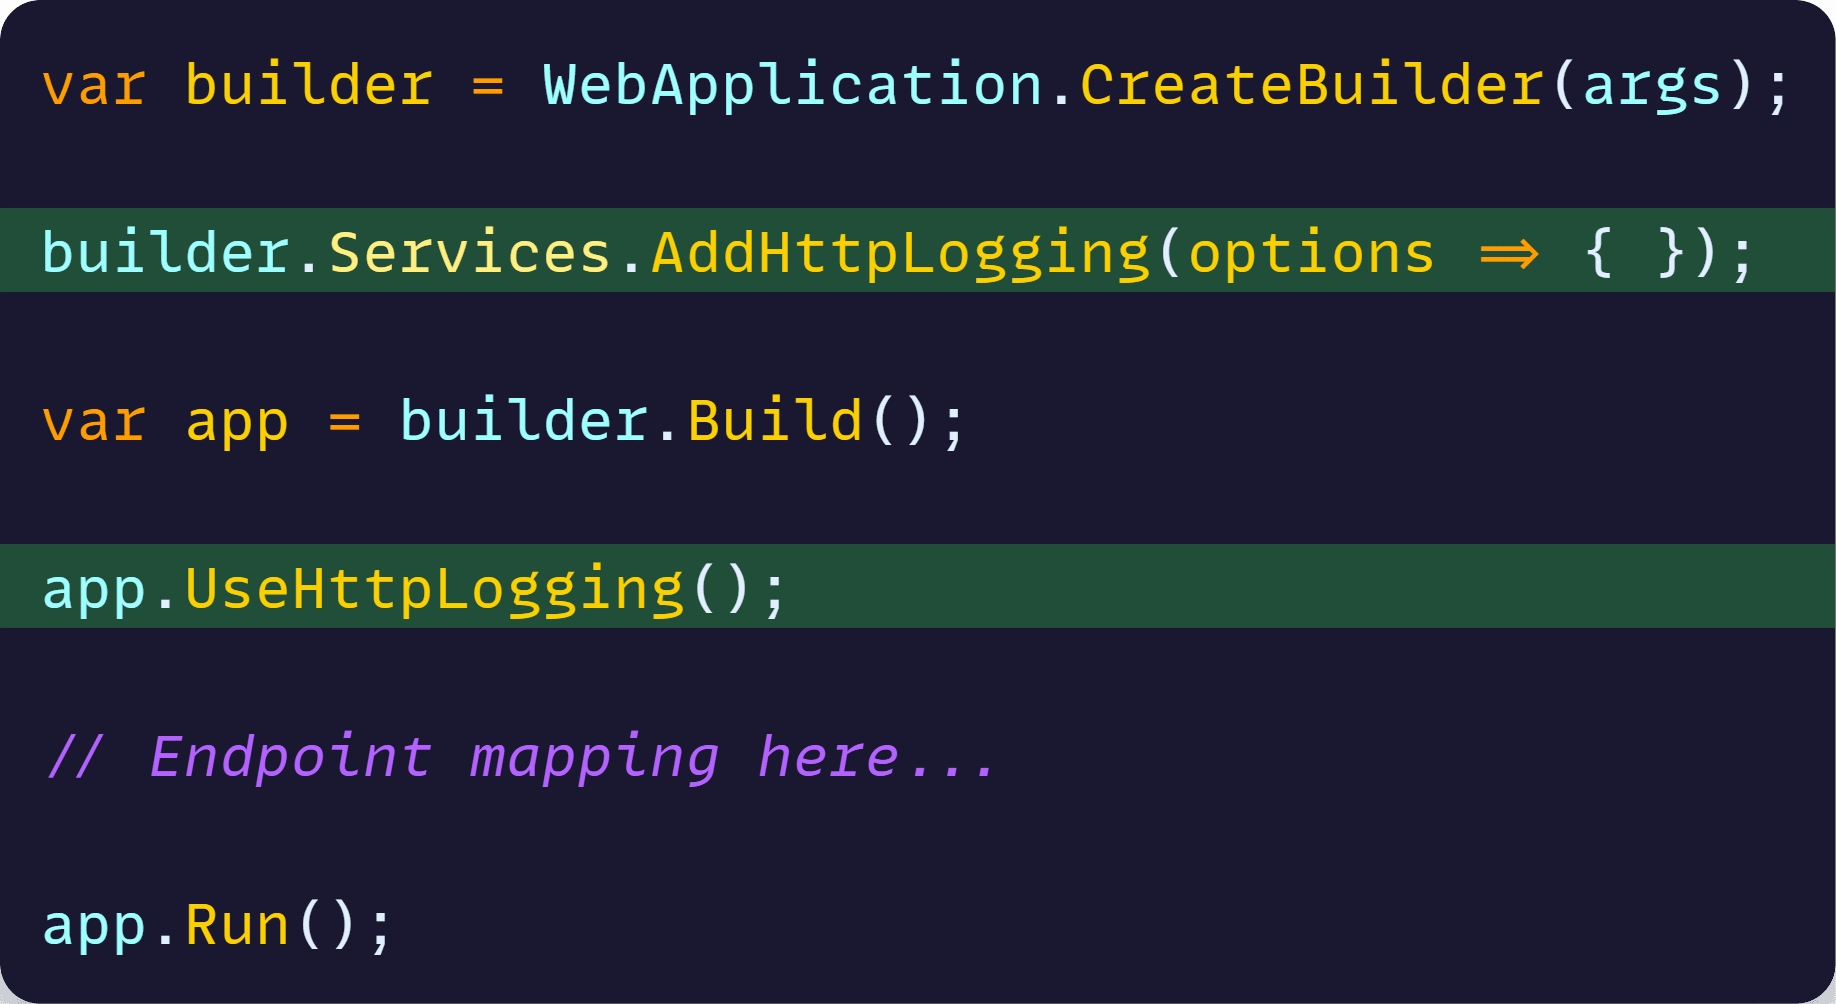
In the past, you would have had to log every request yourself, maybe by writing your own middleware, but today you can turn it on by just adding these 2 lines to Program.cs:
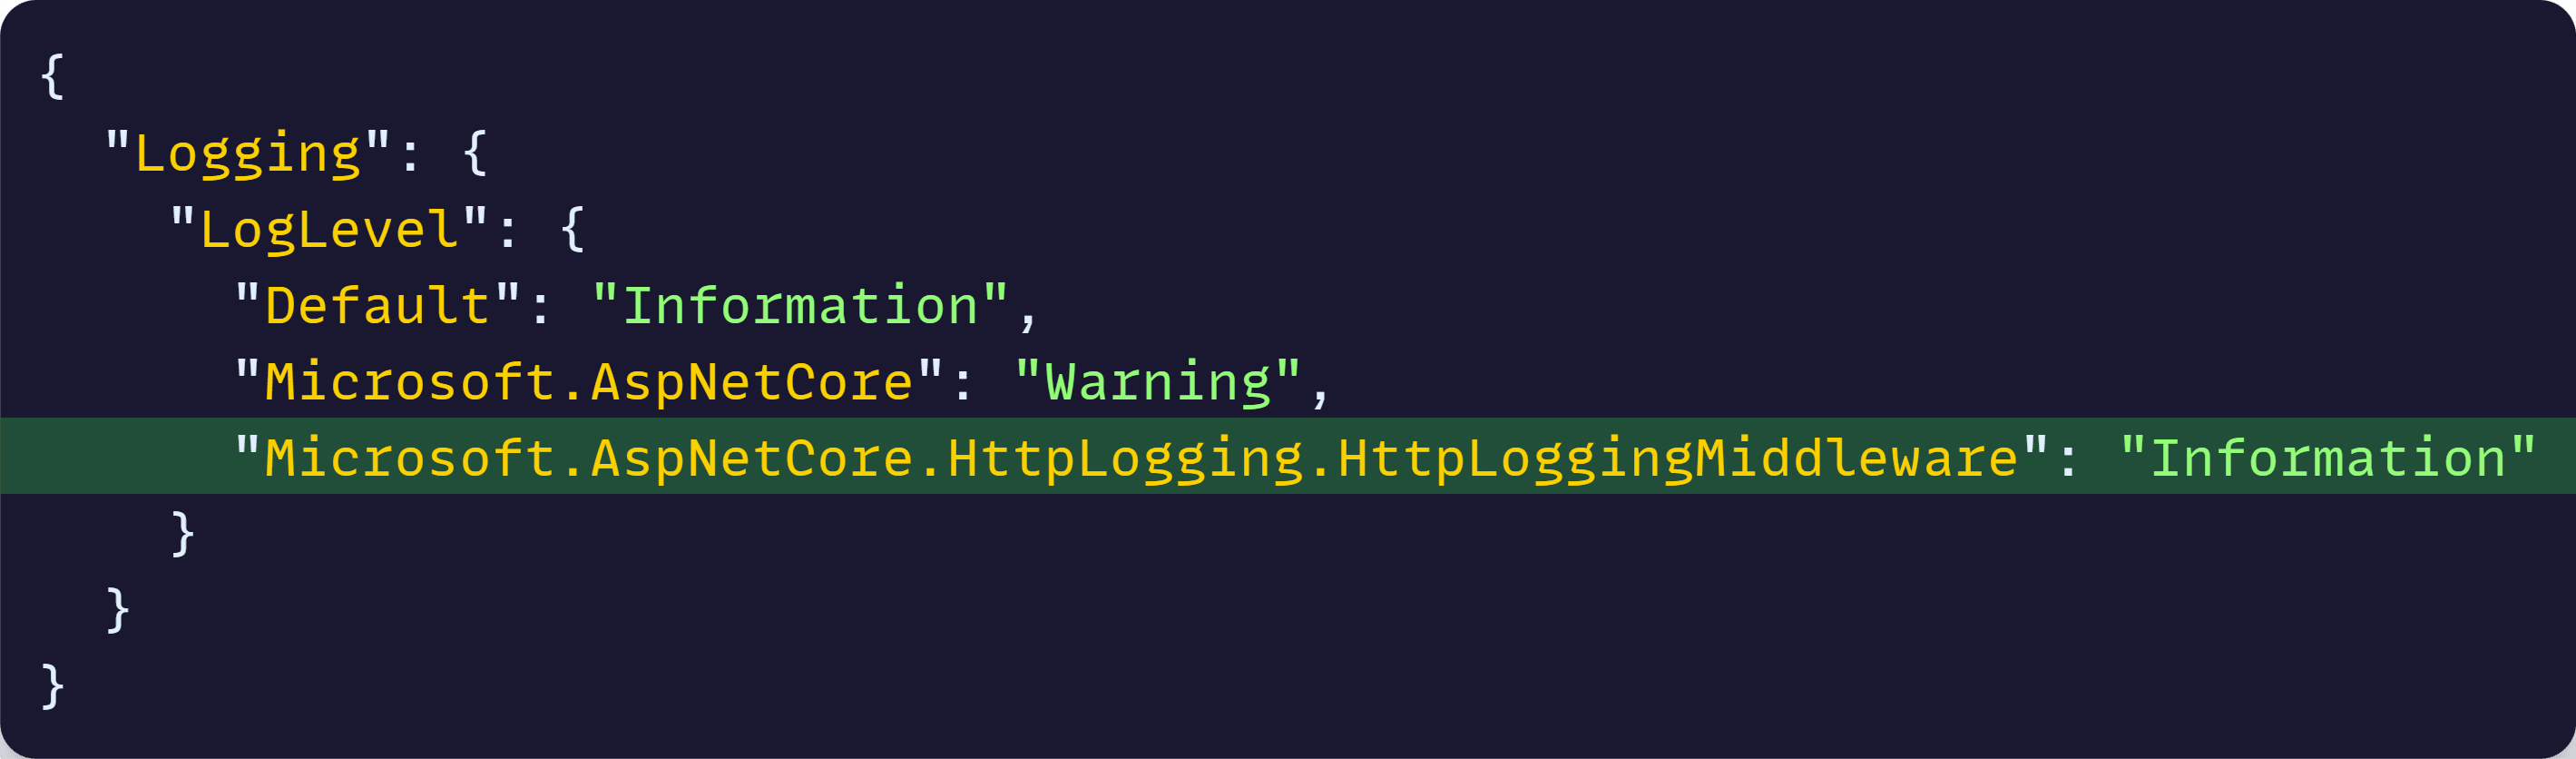
Just remember to also bump the log level of the HTTP Logging middleware to at least Information in appsettings.Development.json to ensure the logs actually show up:
Now, any time your app handles a request, you will get something like this in your logs:
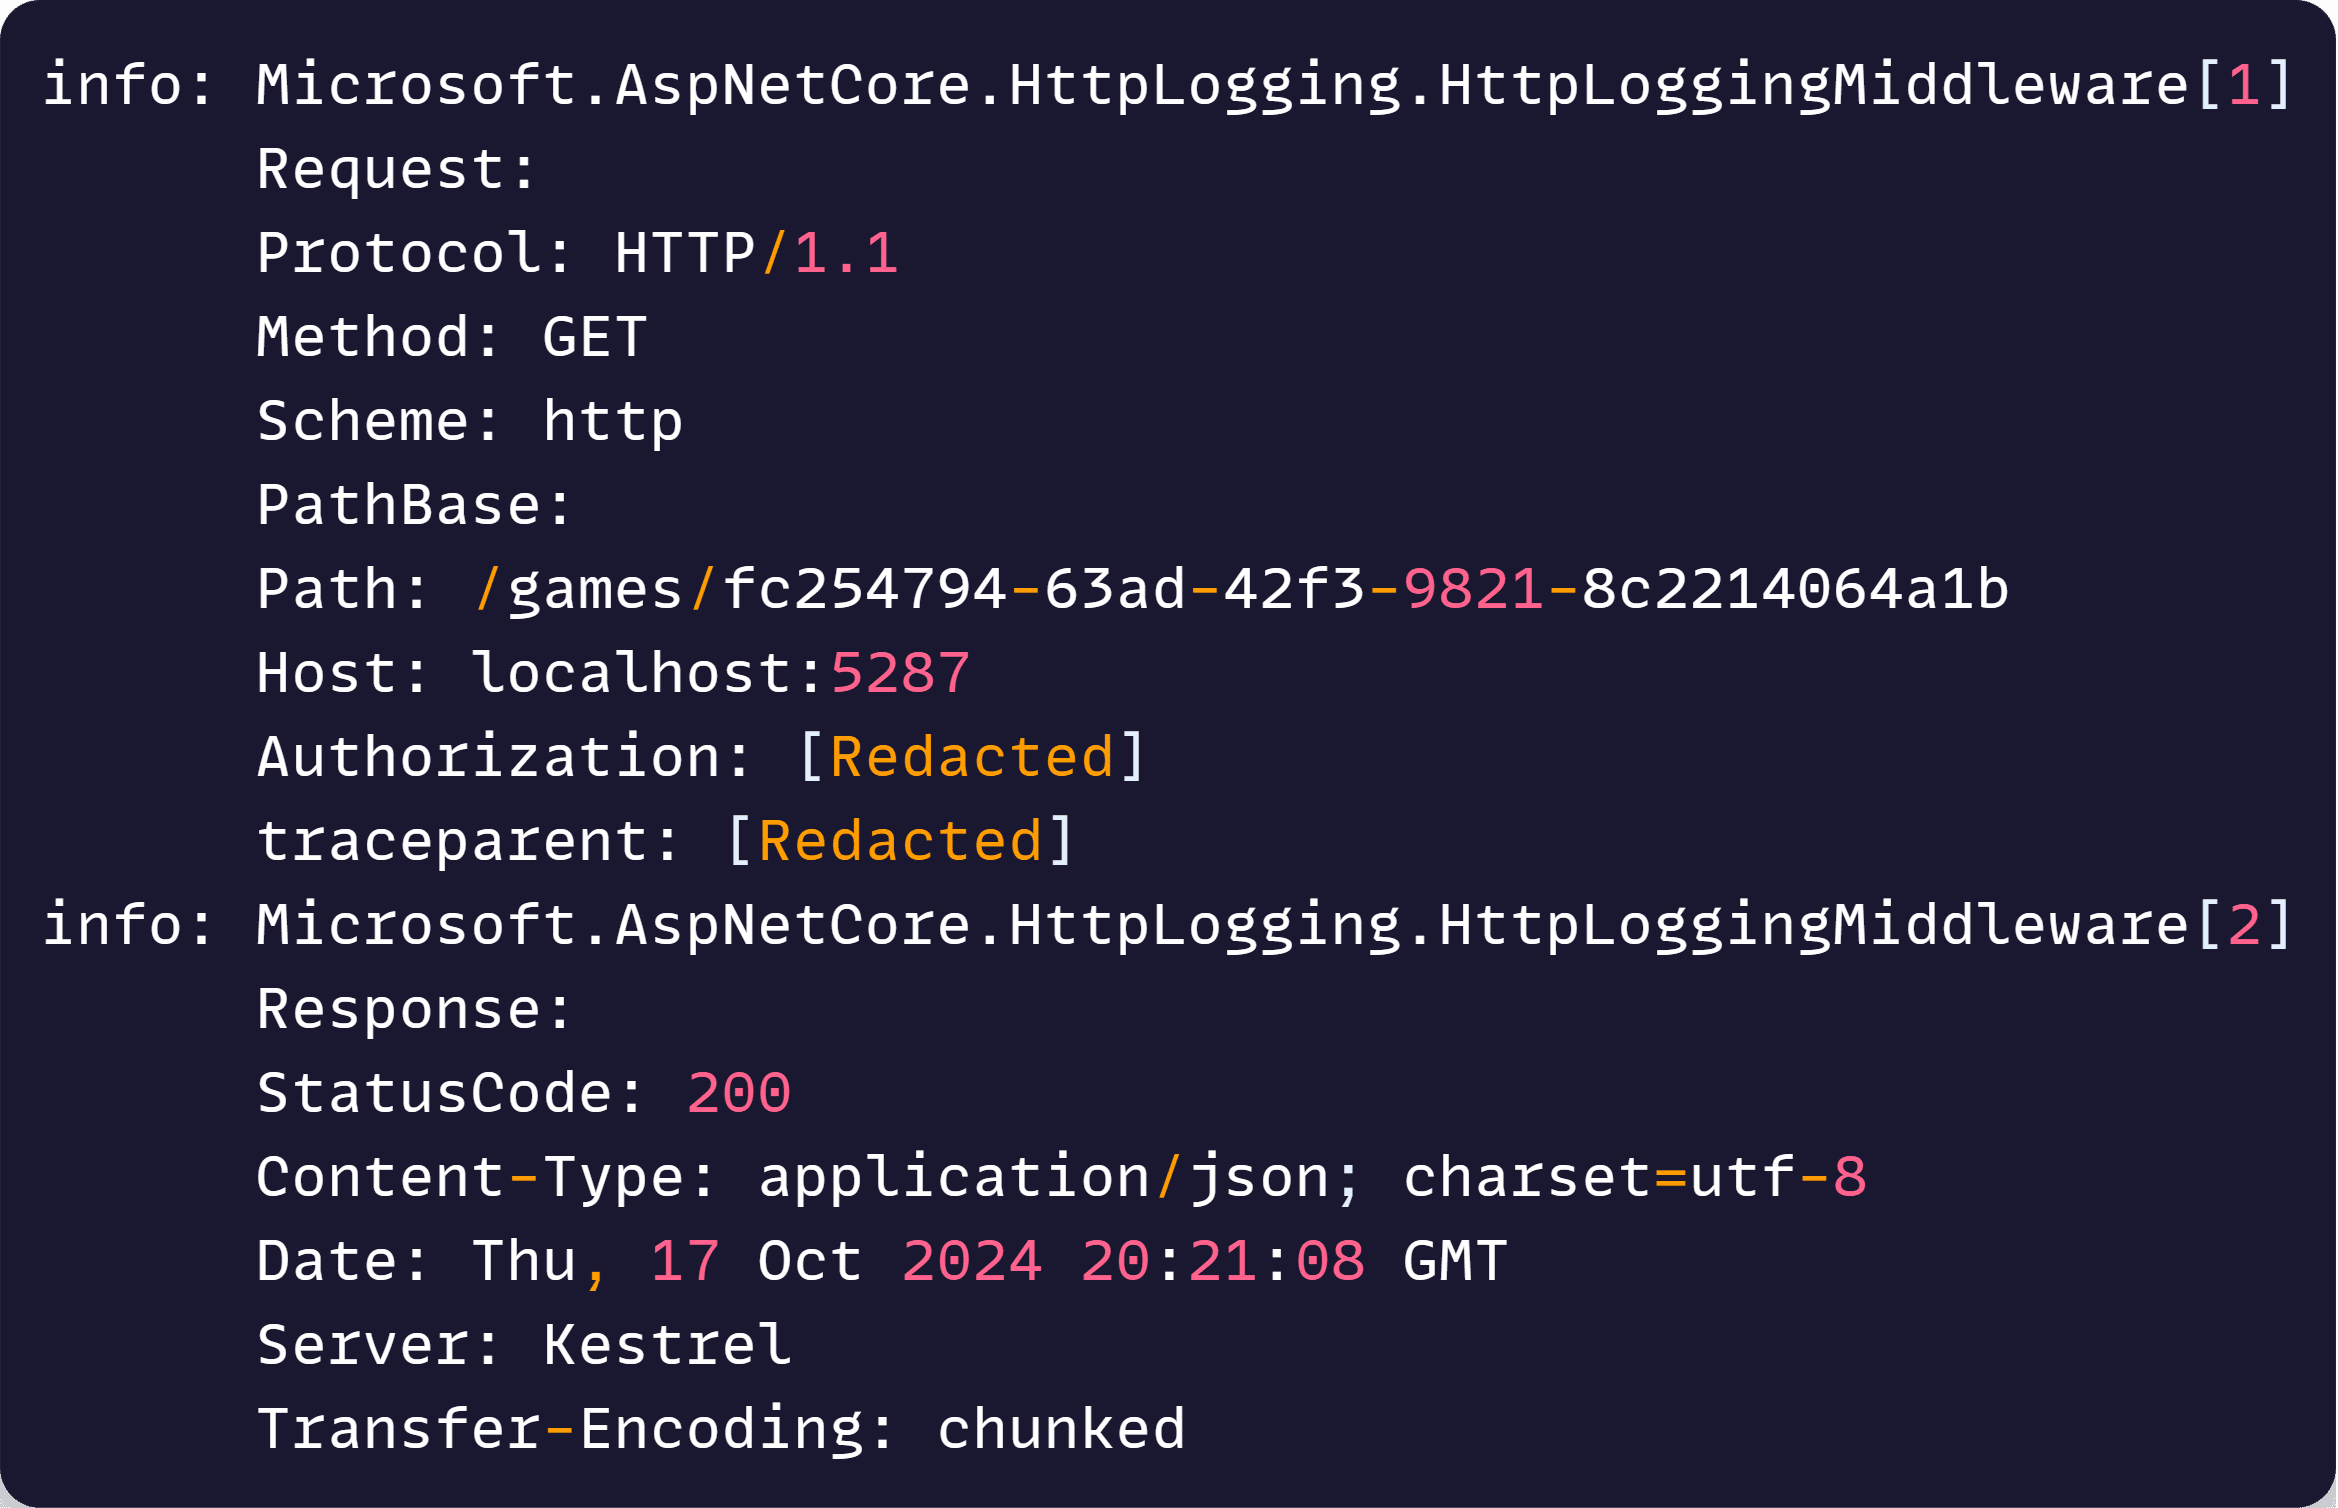
The first log is the request, and the second one is the response, which I think is a great start for just adding 2 lines of code and 1 line of configuration.
But we can do better.
Customizing log fields
As with most things in ASP.NET Core, you can configure several options on the HTTP Logging middleware.
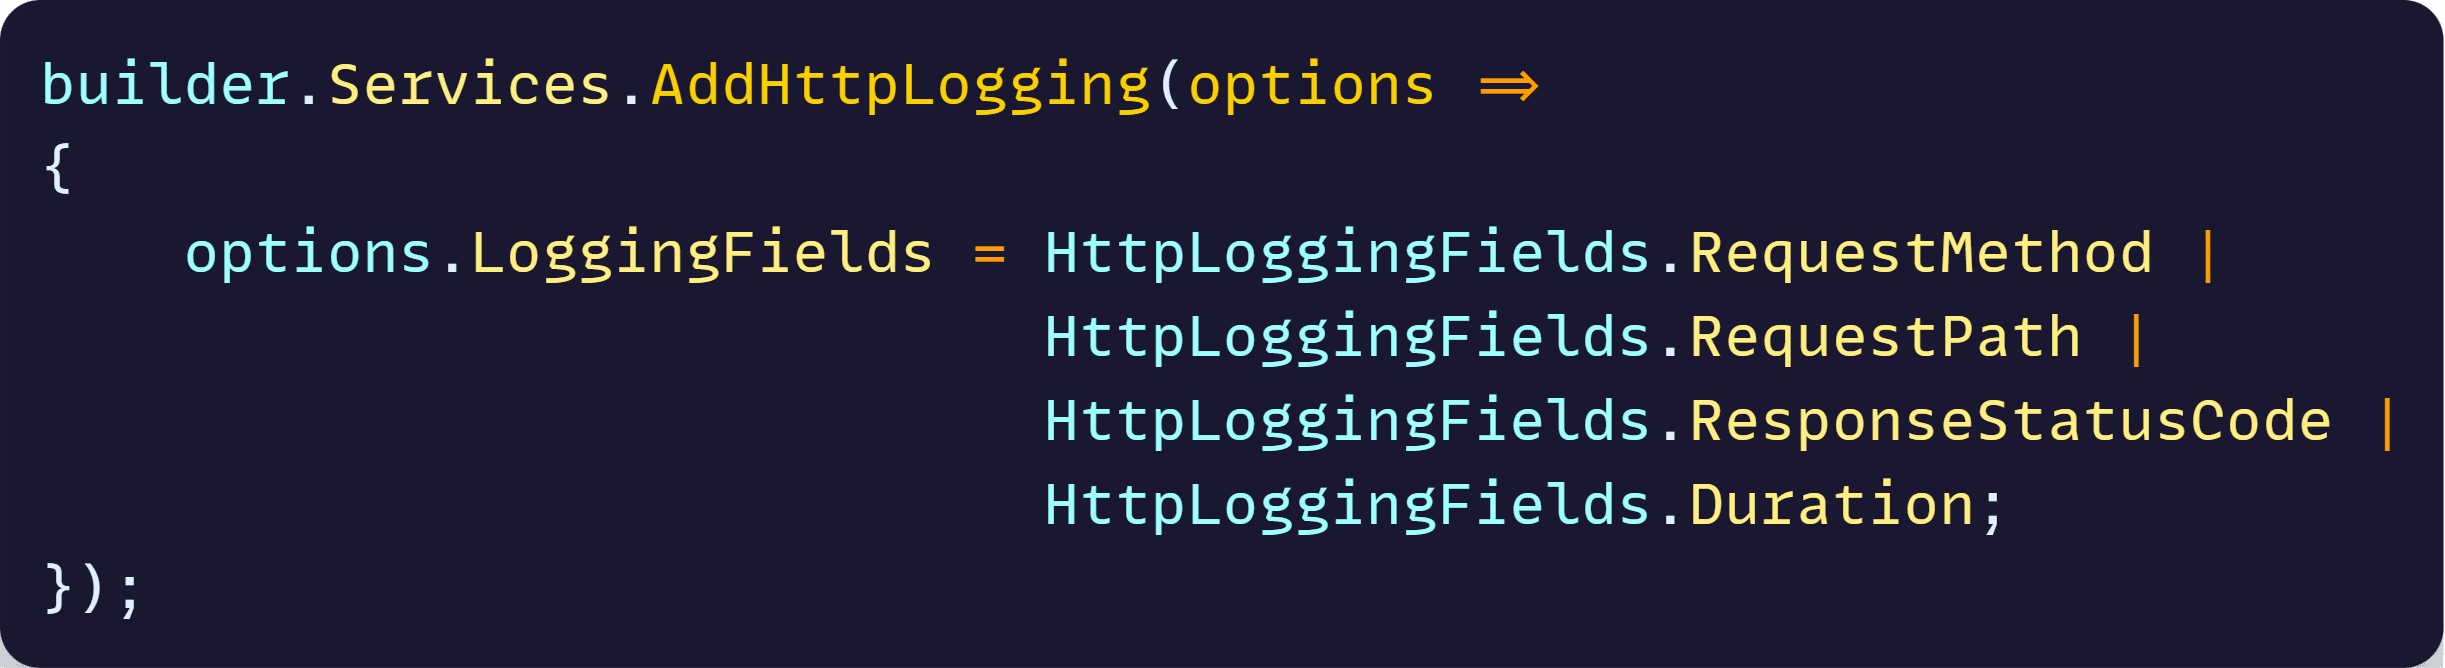
For instance, you may want to log specific parts of the request or response, and maybe even include the request duration. For this, all you have to do is set the correct flags on the options delegate:
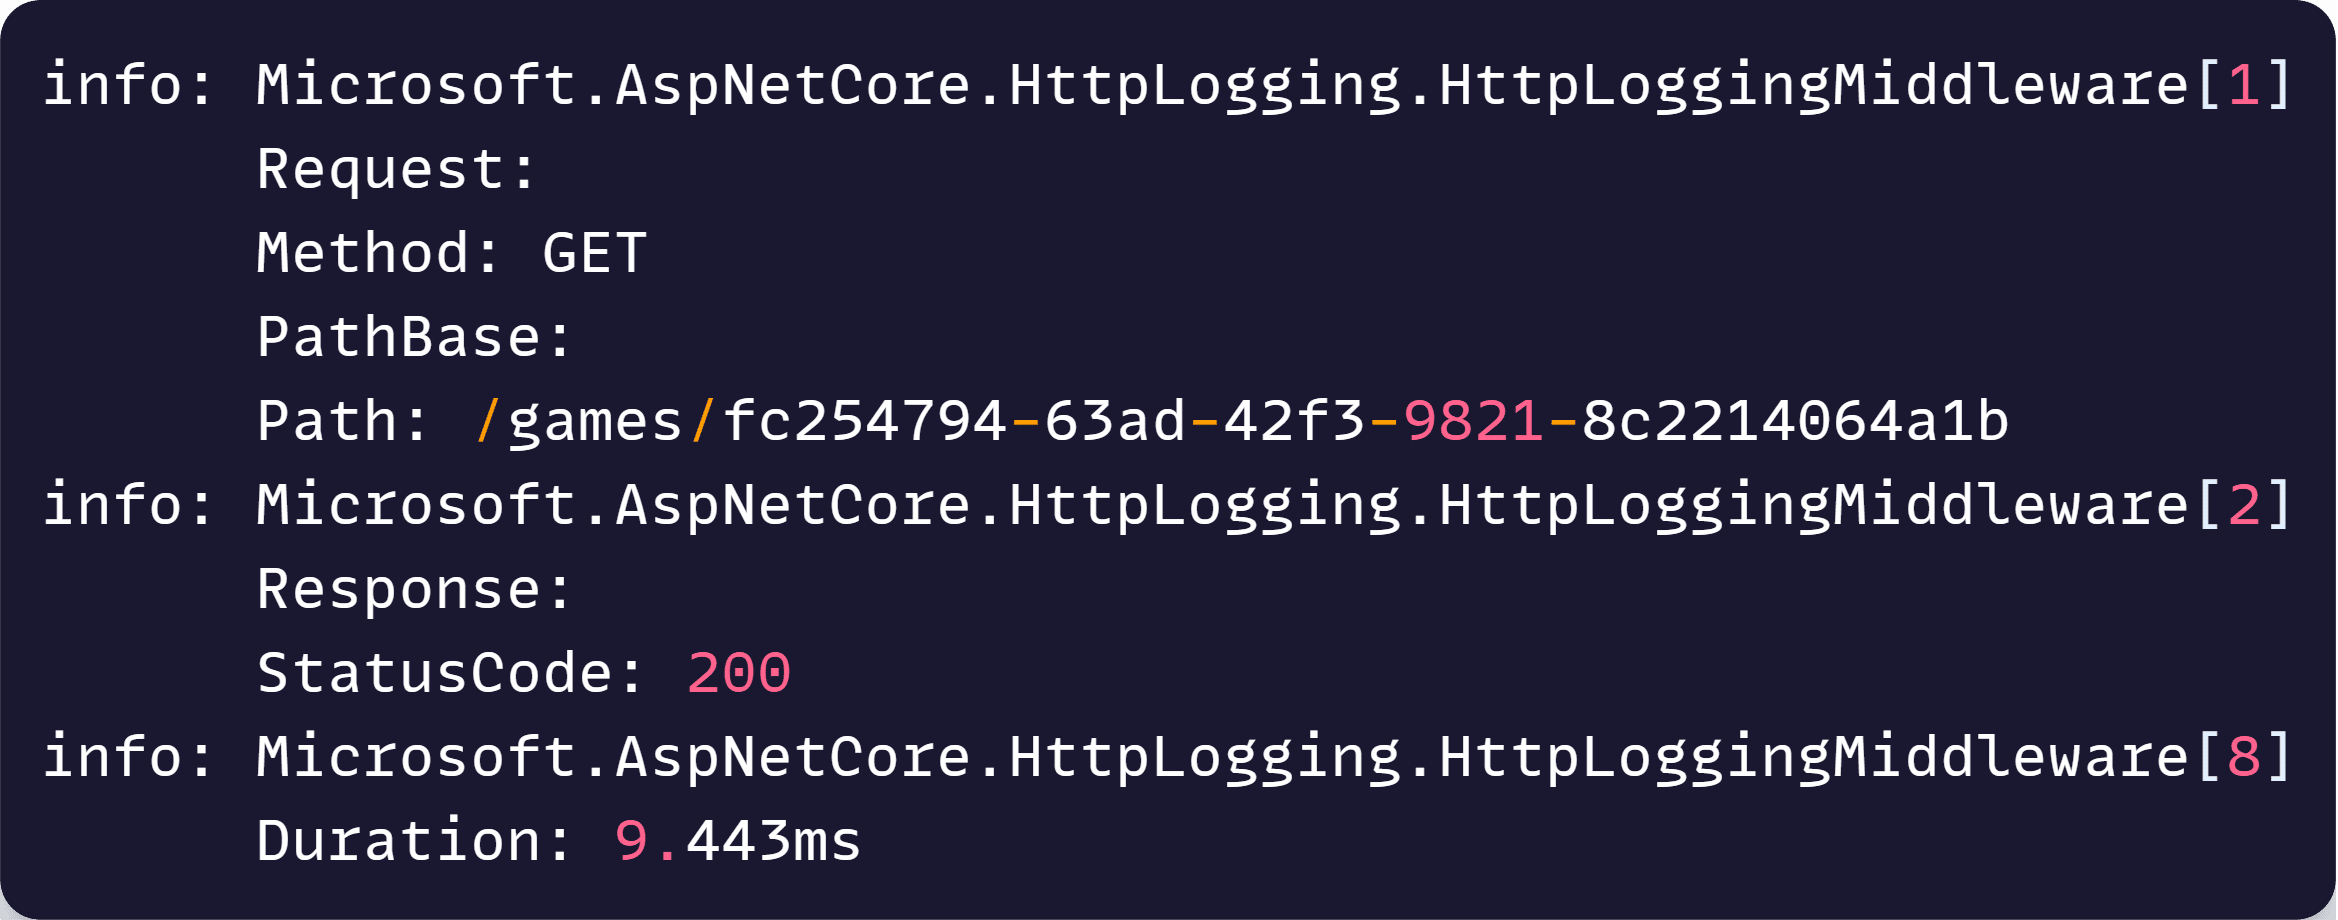
And you would get this:
There’s also an HttpLoggingFields.All, which will even print out the request and response body (shortened the response body here since it is very long):
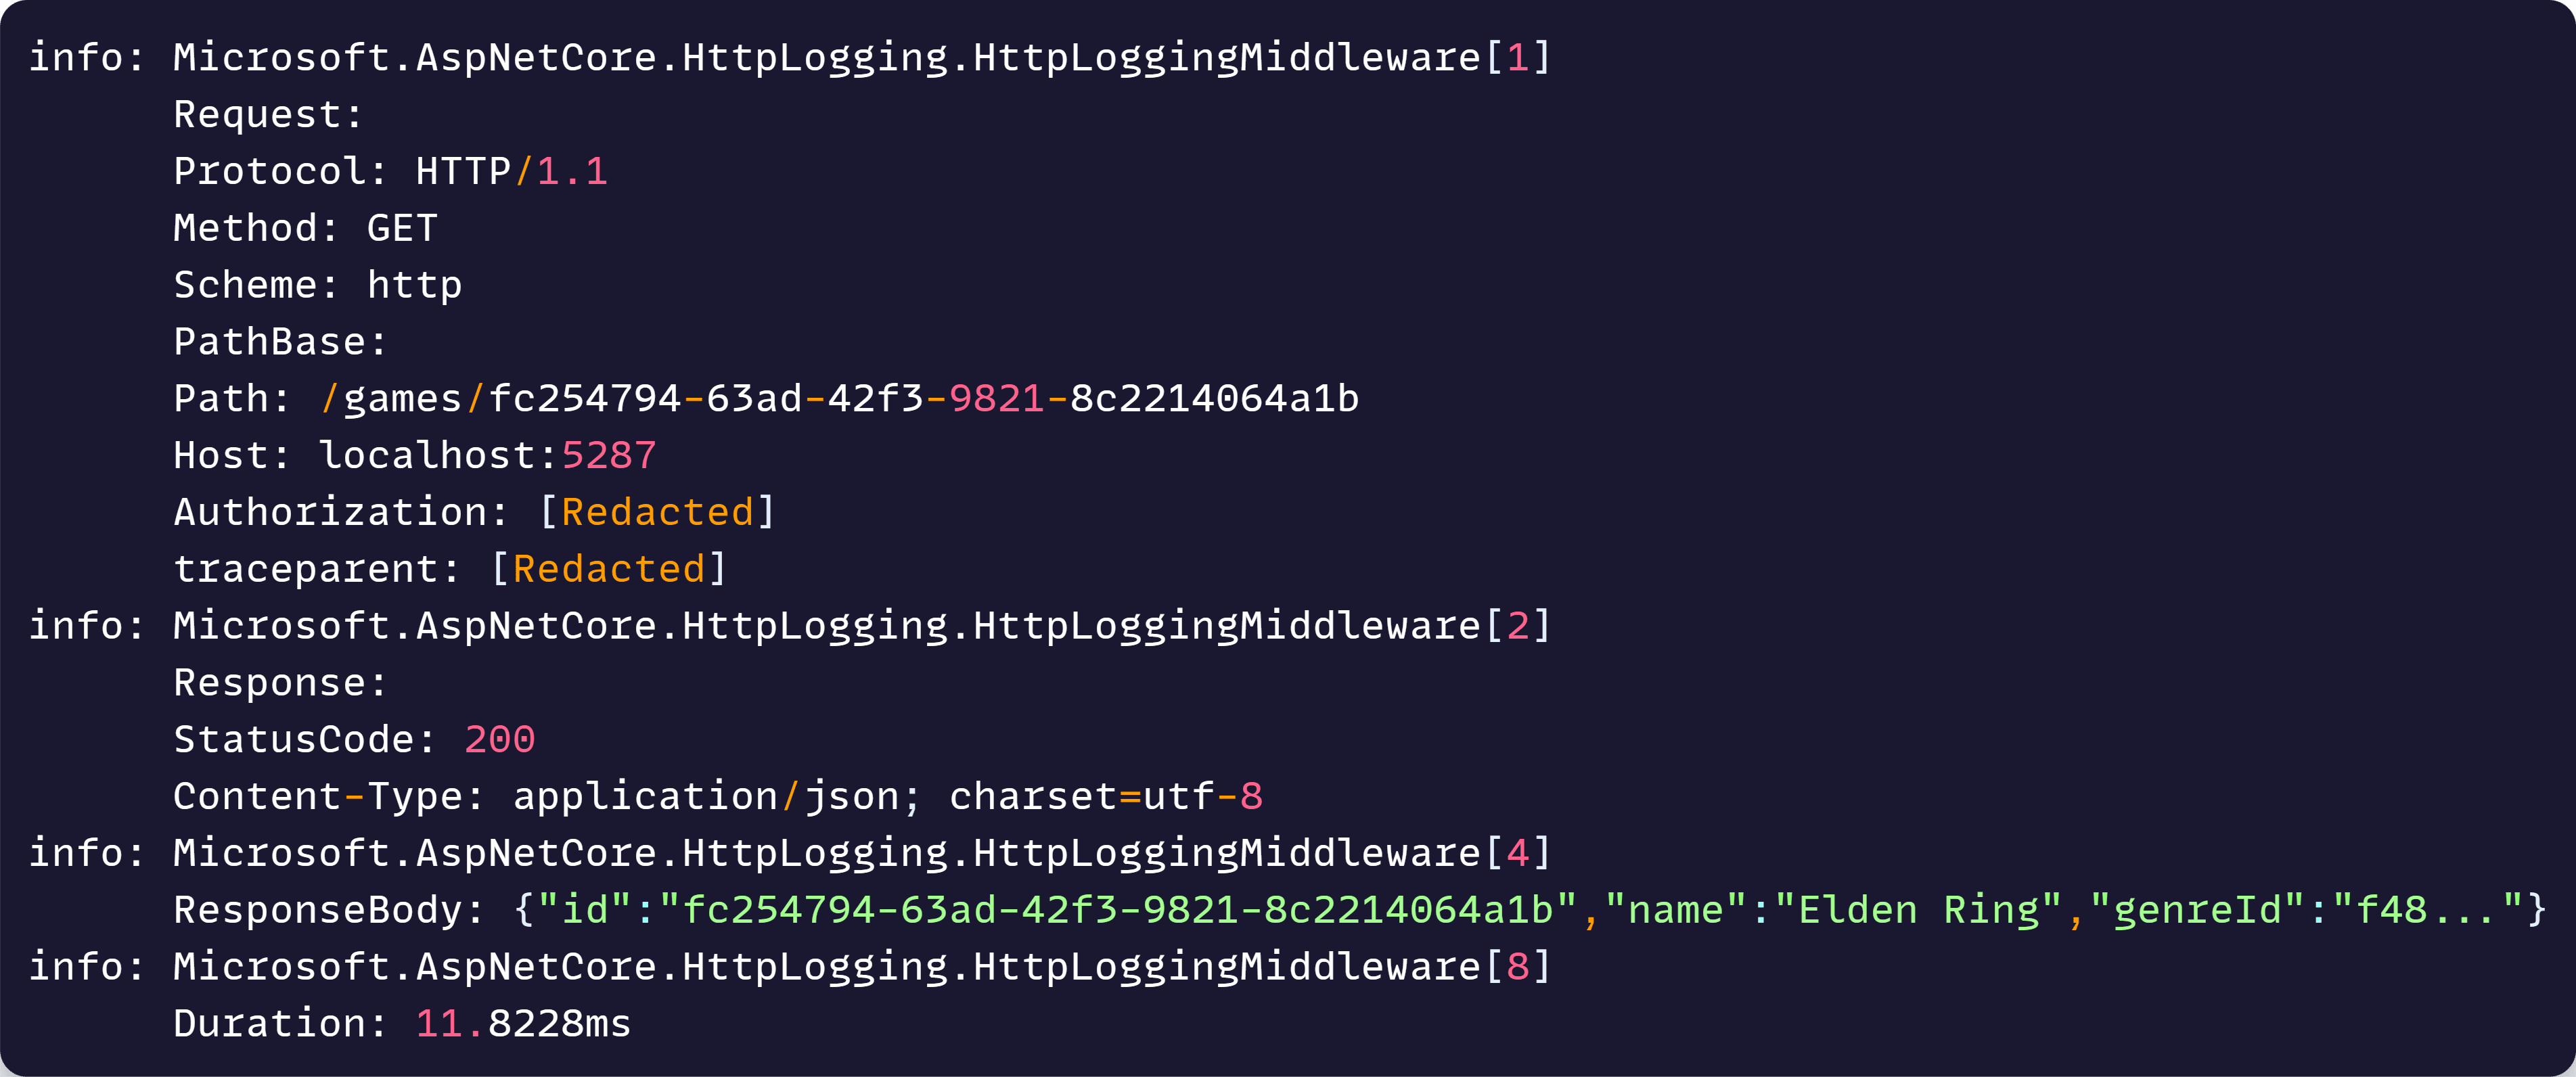
Yes, logging a POST request is likely going to be much more useful, but you get the idea.
Combining logs
I find it handy to have a single log line that contains both the request and response info, as opposed to multiple log lines that might be hard to correlate.
Turns out that’s easy to do too:
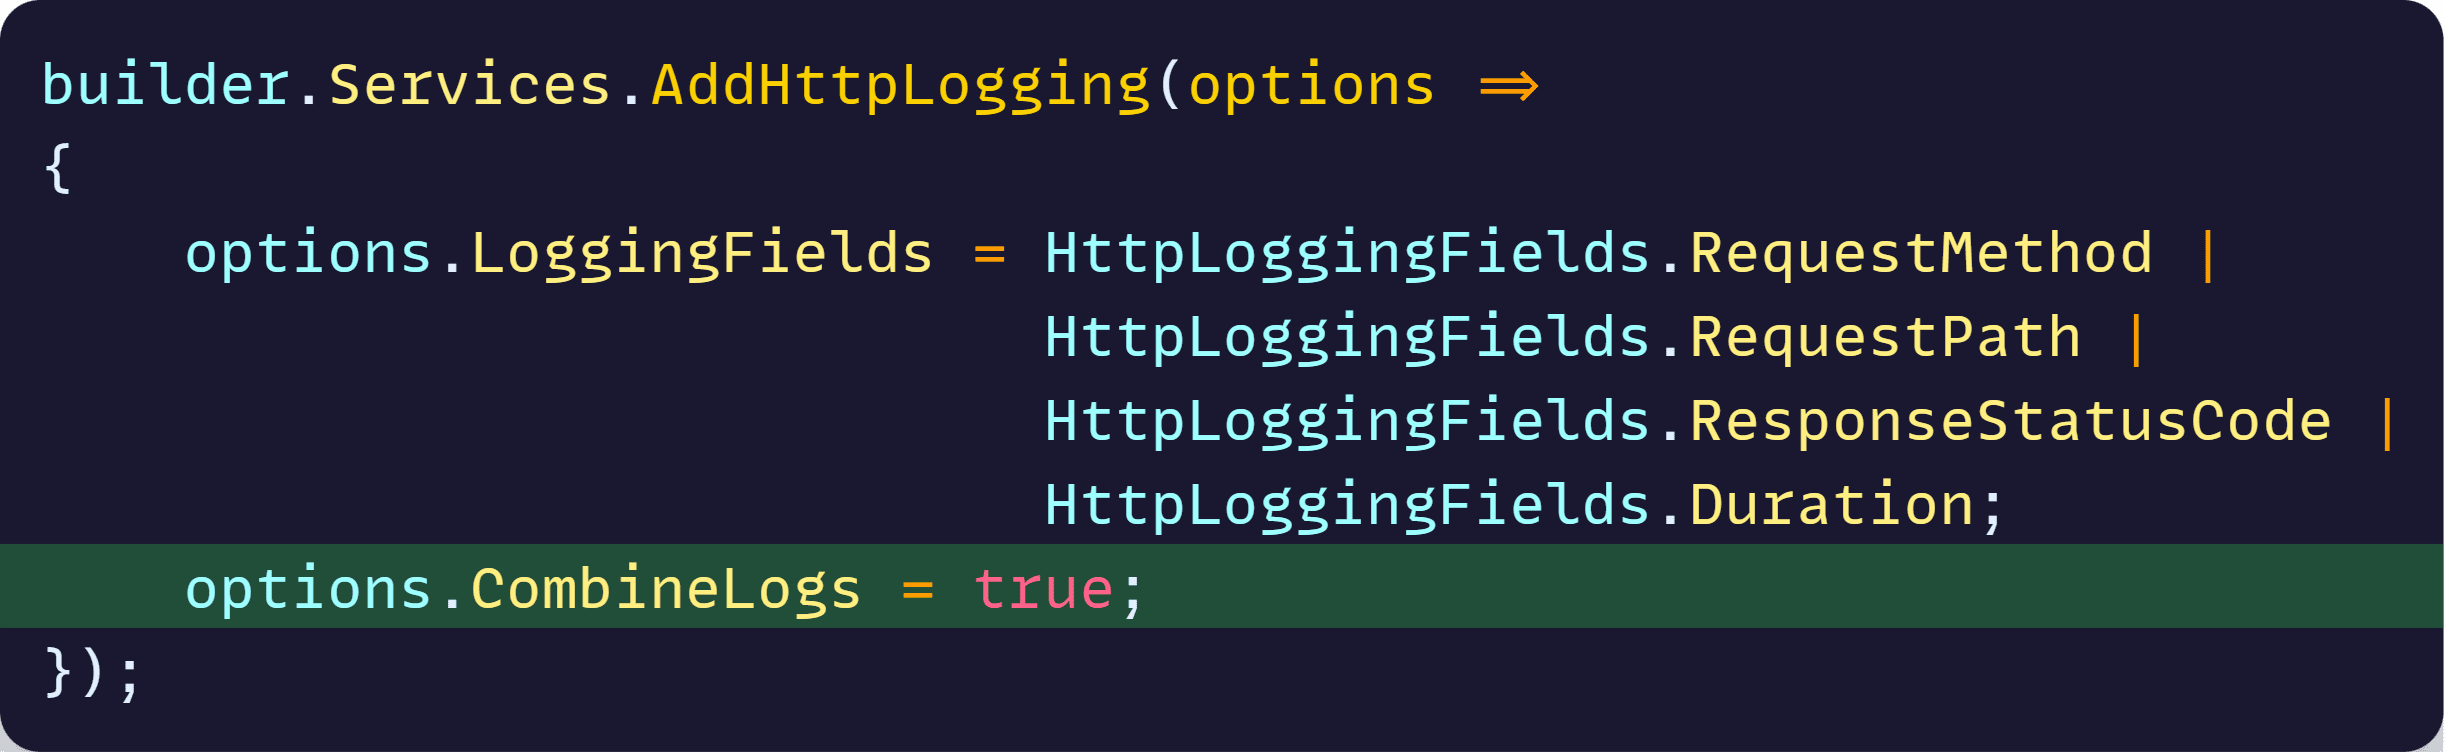
Which will show like this in logs:

So useful!
And, notice this uses structured logging, so each of those fields should show up as their own column on your logging store like Seq or Azure Application Insights, which would help a lot with troubleshooting.
Wrapping up
If you are interested, I’ll go over logging and how to use those logs for troubleshooting issues in Azure in the bootcamp.
By this time next week, I should be done recording most of the first course, with the bootcamp available for purchase as soon as courses 1 and 2 are ready.
The third course will likely land just a few weeks after that, hopefully around Thanksgiving week.
Now, back to work!
Julio
Whenever you’re ready, here’s how I can help:
The .NET Developer Bootcamp: A complete path from ASP.NET Core fundamentals to building, containerizing, and deploying production-ready, cloud-native apps on Azure.